Systems fail. New ones emerge. The people who recognized the shift from broadcast to streaming, from cash to digital currencies, from the trading floor to the algorithm were not lucky. They were positioned. This program helps students get there first.
Training students to use AI tooling, not fear it.
Our program has helped students get jobs since 2018. Before COVID, during COVID, and during AI adoption. Our program puts students in charge of these agentic tools and Large Language Models, toward three shared goals:
We did it first with Excel and CSV downloads, then with Colab and Jupyter notebooks. Today those are mostly a reference point: a way to see what LLMs and agentic processes have replaced or improved on, even as a few still earn their place in our stack. The overarching sentiment about AI and the opportunities for graduates is wrong-footed. Our program provides the proof.
Large Language Models are collapsing the cost of, and the distance to, intelligence. But not wisdom. Not judgment. Not utility.
At their best, they advance an idea and execute a defined task. At their worst, they hallucinate and flatter: The result? An engagement that is confident, fluent, but sometimes wrong. Very wrong.
This is why "human in the loop" has entered our lexicon. But a human in the loop is not enough. The loop needs a well-resourced human: one with the domain knowledge, the tested priors, and the self-knowledge to direct the model rather than defer to it. These are the skills and characteristics we help foster.
And the resource that matters most is context. Context used to be a broad term. AI has changed that. Everyone now draws from the same wholesale intelligence, the way refiners draw from the same crude; the edge is in what you refine it into. Harnessing context to drive differentiated outcomes is today's key differentiator for anyone employing LLMs. The topics that follow are how we build it.
Before we hit the keyboard, we read three pieces. Together they are one arc, from the widest frame inward.
Markets are not the starting point. They are downstream of something far larger. So the program opens by situating the student between two realities: the physical world of matter, energy, time and space, and the human world of imagined realities that we invent and then have to live inside. Money is one of those inventions. So is the Federal Reserve. So, in a sense, is the market itself.
Matter, energy, time, space, and then us. Our singular trick is the imagined reality: the shared story (money, nations, institutions) that exists outside matter and time, and yet moves the physical world. We are, in the end, the gossip, the storytellers whose fictions become the rails everything else runs on.
Excerpt: Sapiens — Yuval Noah HarariThe brain has two ways of meeting the world: one broad, contextual and integrating; the other narrow, reductive and deductive. We each run some blend of the two, and that blend is part of why no two people read the same data the same way. It is also why a Big Five profile varies from person to person: temperament is, in part, how left-brain or right-brain, how reductive or holistic, you are wired to attend.
Excerpt: The Divided Brain — Iain McGilchrist (RSA Animate)Imagined realities do not hold themselves together. Someone has to tend them.
When the integrating, contextual hold weakens, systems fragment. In terms of a sovereign's weakening center, it comes from more debt, often poorly allocated, and a less satisfied citizenry, all weakening the integrity of the system, the story. That is not a metaphor. It is a description of what happened between 2008 and 2018, visible in real time in the US Treasury market, which is the deepest, most liquid market in the world and the one that tells you, faster than any other, when confidence in the story is slipping.
In 2018, St. Louis Fed President James Bullard marked his first decade in office with a piece called Unconventional: A Policymaker's Reflections on Crisis to Recovery. It is worth reading not because Bullard is right about everything, but because he is honest about the limits of the tools. When conventional policy ran out, when the short rate hit zero and could go no lower, the Fed did not go quiet. It reached for a different kind of instrument. In April 2011 it held the first press conference in its history, one chair at one podium speaking for the institution on a fixed schedule. In January 2012 it published the first dot plot, compressing the rate expectations of nineteen officials into a single chart the whole market would come to trade against, and in that same meeting it fixed an explicit two percent inflation target, anchoring the story to one number. Three moves, all inside ten months of the zero bound. Bernanke called the dot plot aggressive forward guidance. When the Fed could no longer move the rate, it moved the story about the rate.
These were not mechanical moves. They were acts of narrative management, and notice their shape. As the real center weakened, the Fed did not get louder. It got more orchestrated: fewer voices, one podium, one chart, one number. The map became the thing the market traded on, even as the Fed insisted the dots were not a plan. The Fed did not just change rates. It managed a story.
And the Fed is not alone in this. Governments shape narratives around debt and deficits. Companies shape narratives around earnings. Central banks shape narratives around inflation expectations. When the United States needed to finance World War II, it did not simply issue bonds. It ran a campaign: Uncle Sam Wants You, Buy War Bonds, sacrifice as patriotic duty. The Treasury turned fiscal necessity into shared identity, and it worked. Every major institution with a stake in how the imagined reality of money is perceived has, at some point, worked to influence how that perception forms. That is not cynicism. That is how imagined realities are maintained.
But maintained is not the same as permanent. Imagined realities can and do fail. The confidence drains, the story loses its hold, and what looked like bedrock turns out to have been consensus. It has happened to currencies, to sovereigns, to financial systems built on assumptions that went untested for too long. When it happens, the people who saw it coming were not smarter than everyone else. They were more grounded, more willing to test their priors, and more honest about what the data was actually saying versus what they were told to expect.
That is the real reason these three lenses matter. Not as intellectual furniture, but as preparation. Are you positioned to see it? Are you data-driven enough, and self-aware enough, to trust what you see when it runs against the consensus?
Our canonical piece, Can't You See, focuses all three lenses on exactly this problem in traditional finance: the structural stresses accumulating beneath the surface, why so few in the industry are looking, and what a grounded, data-driven analyst does about it.
Through-line: The universe. The brain that reads it. The imagined realities that brain builds, and that institutions tend, shape, and defend until they break. Know your instrument. Test your priors. The next regime is not a threat. It is the opportunity. This program is how you prepare to own it.
The same framework that powers the Risk Dimensions platform, taught from first principles.
Since the Global Financial Crisis, economic, political, and social dynamics have become uniquely intertwined. The program focuses on the growing linkages among three verticals, then teaches students to move from ideas, to data, to insight.
Production, distribution, consumption and store. GDP = G + I + C + Net Exports. Money supply, employment, inflation, deficits, and debt-to-GDP. Prep: Ray Dalio, How the Economic Machine Works.
Equities, Credit, Rates, Currencies and Commodities. Interest rates are the lynchpin of valuation: they price everything else. From the birth of fiat FX in 1971 to today's concentration of equity capitalization.
Central banks, pensions, politicians, corporations, and AI, and You: the consumer, the student, the investor, the voter. Prep: The Fed, the ECB, Your Brain, Factfulness, and the world's changing demographics.
The original method. Lab I moves from ideas to data: define the terms, drop them into top-down and bottom-up frameworks, then ingest and order real data and apply analytics (rates of change, volatility) to find the trend. Lab II moves from data to insight, a farm-to-table exercise: identify the source (FRED, the World Bank, the IMF, the BLS), ingest it, and build the graphs that tell the story. M2 versus GDP. Home prices versus wages. US debt versus interest expense.
The same discipline today. The farm-to-table exercise still runs; the kitchen has changed. Data now arrives through APIs into Postgres tables, where vibe-coded Python scripts ingest, transform, and visualize it through processes hardened by rigorous review and testing. Then we drive frontier-model intelligence through our curated context files, so the output is not generic AI but a differentiated insight grounded in our experience and our tilts. The discipline of Lab I and Lab II did not change. Only the leverage did.
The advent of agentic workflows and the intelligence unlock of LLMs marks a shift from the consumer economy to the creator economy.
Tooling and opportunity become abundant for the creative, the able, and the willing.
“Know thyself,” the calling Socrates made his life's work. Maybe more relevant than ever.
The critical component of the program.
In the age of AI, anyone can retrieve information. The answer is a prompt away. That is precisely why the scarce skill is no longer access to intelligence; it is the wisdom and vision to apply it. A student who does not know their own bias, their own strengths, and their own blind spots will be carried by whatever the model produces. A student who does will use the model as leverage.
So we begin with the self. Because your own tilt, how reductive or holistic you run, colors every read you will ever make, the first move is to measure it. Only then do we hand over the tooling. The result is not a human calculator competing with a machine. It is an architect and editor who sits above a bench of AI tools and is answerable for the output.
Before you touch a single dataset, you assess yourself. We use the Big Five Aspect Scale, a 100-item instrument that scores not only the five traits (Openness, Conscientiousness, Extraversion, Agreeableness, Neuroticism) but the ten aspects beneath them, two per trait. That granularity is the point: it surfaces your dominant and recessive traits, the same left-brain/right-brain, reductive/holistic balance the divided brain describes. It is the scientifically grounded cousin of Myers-Briggs and the accessible analog to Personalysis.
The test is free: no payment, no email. So the investment is not money, it is your honesty and your attention. That is the first deliberate act of the program: you sit with an unflinching map of how you are wired, and you own the result.
The principle: The tools are more powerful, therefore you must be more grounded, more self-directed. Otherwise the model will direct you.
From Excel downloads in 2018 to today's API-fed, LLM-infused model. The tooling changed every year. The thinking compounded.
In-person sessions building market analysis from first principles. Students pulled data by hand, downloaded it into Excel, and learned to interrogate it. The lesson under the lesson: a number means nothing until you understand what it measures and what it hides.
Tooling: Excel downloads · manual data pulls
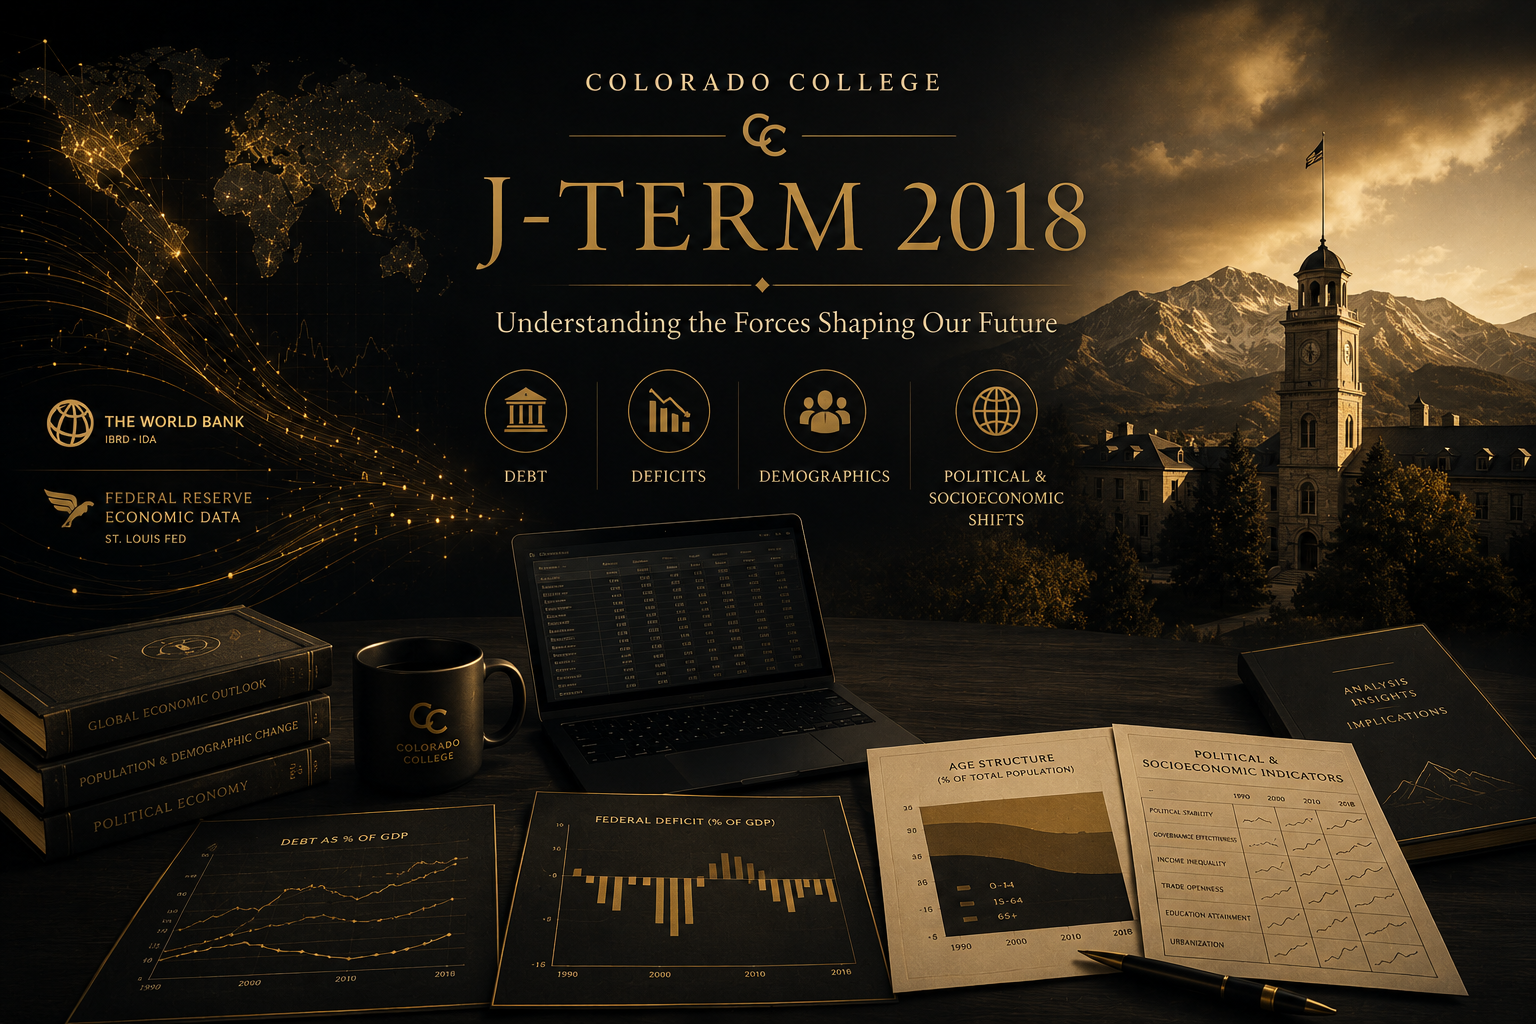
The program went remote, and a multi-university cohort (Boston College, CUNY's Baruch and City Tech, UNC Chapel Hill, and the University of Virginia) built a single capstone: an exploration of the linkages across Economics, Markets and Players as debt grows, interest rates drop, and populations age. Built in Excel and Tableau on primary-source data from FRED, the World Bank, the IMF, and the BLS, the work was presented to the Dallas Federal Reserve's Markets Team on September 11, 2020. Proof that students, properly mentored, could meet an institutional audience on its own terms.
Tooling: remote collaboration · Excel & Tableau · FRED / World Bank / IMF / BLS
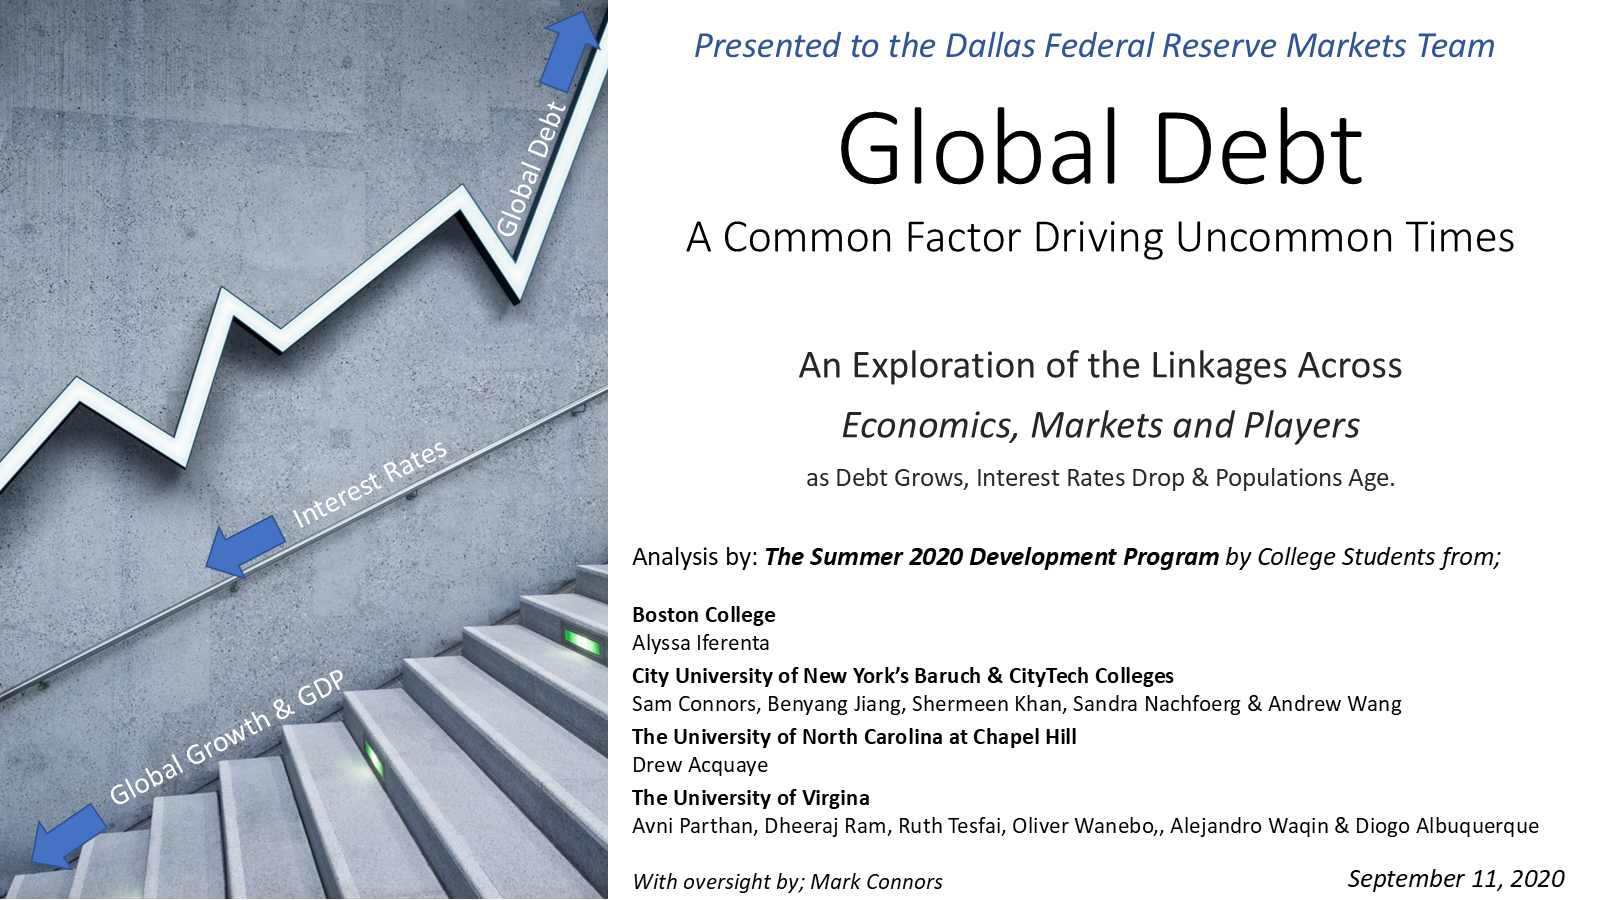
A second remote cohort, refining how analysis is taught and reviewed at a distance, and how students present and defend their work, in writing and out loud.
Tooling: remote collaboration · presentation craftThe work moved into code. The City Tech CUNY team built an institutional-grade multi-asset risk tool: a two-factor PCA across 28 US-listed ETFs spanning global equities, credit, treasuries, commodities, and Bitcoin. An FMP-fed pipeline in Python and Google Colab decomposed market moves into PC1 (market beta) and PC2 (a rotational, duration theme), and tested Gold and Bitcoin as genuine, low-correlation diversifiers. The shift from reading data to modeling it, and from a single worksheet to reproducible, shareable computation.
Tooling: FMP API · Python (pandas / numpy / scikit-learn) · Google Colab · PCA
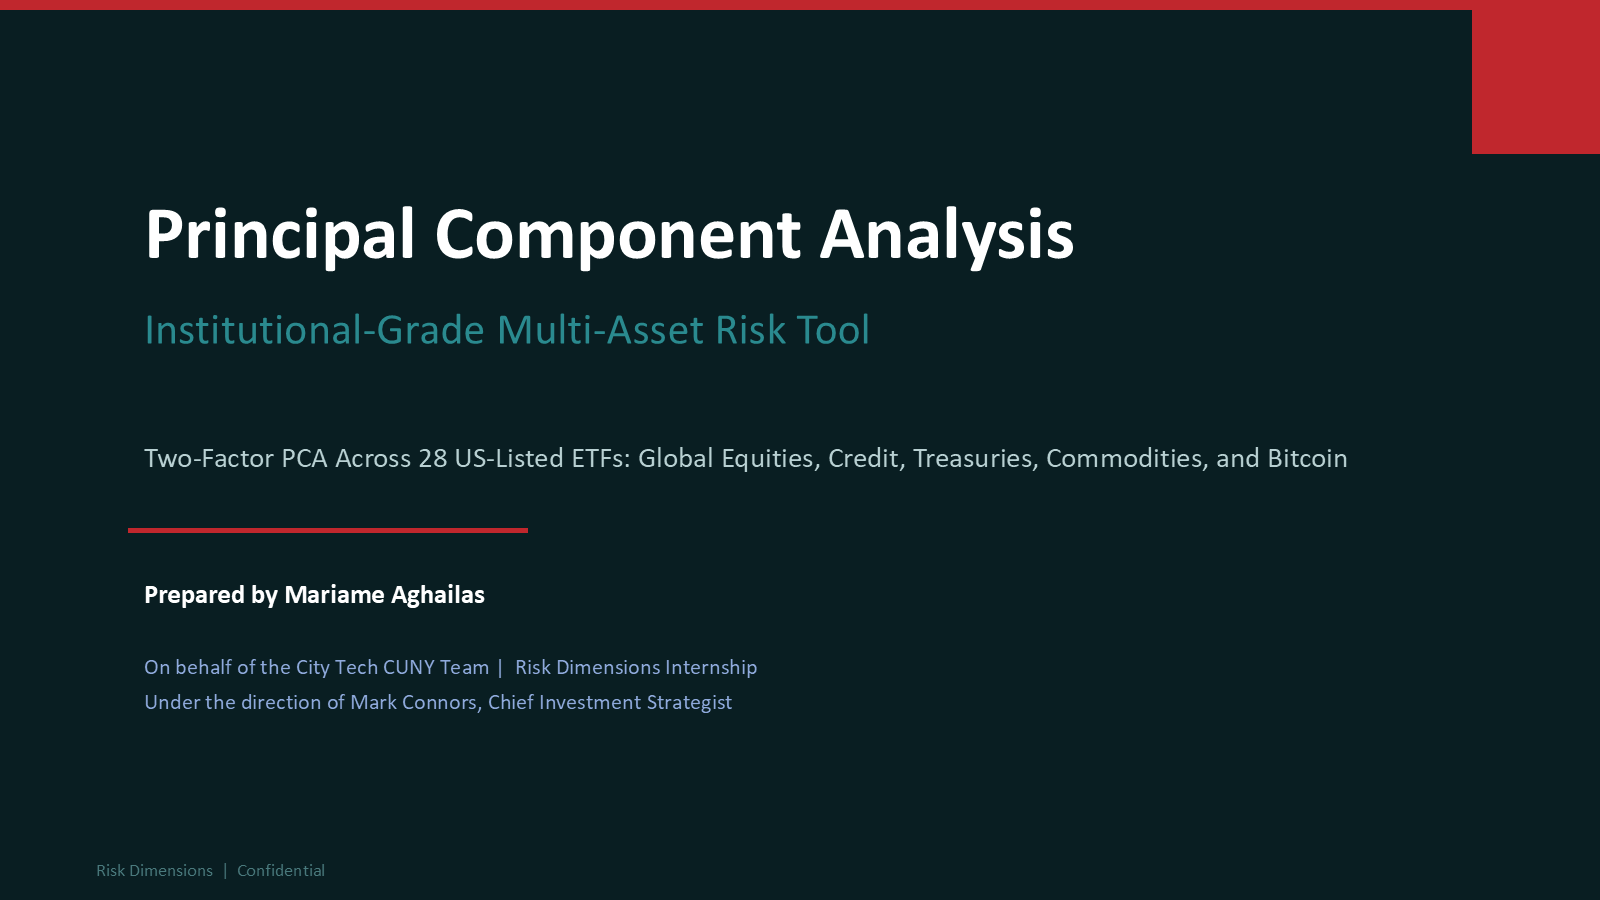
A server-based, API-fed research system with a bench of LLM-powered, context-guided agents. Students remote in and orchestrate it: the model retrieves, drafts, and computes; the student frames the question, supplies the context, validates the output, and owns the verdict. The person is the architect and editor. The same Economics, Markets and Players framework taught in 2020 now runs on live data, and the tooling is leverage applied with judgment.
Tooling: server · API data feeds · agentic LLM bench · context files · Windsurf / Cursor / Wave Terminal
Integrated, not siloed. Knowledge, skill, and bearing taught together.
Real market and macro context, the structural why behind the numbers, built through frameworks, defined terms, the scientific method, and primary-source data. Something to bring to the table the model cannot retrieve on its own.
Hands-on fluency on an agentic LLM bench, built atop the progression from Excel and Tableau through PCA and notebooks: framing the problem, identifying and ordering data, finding the model's errors, and shipping work that holds up. Beyond the chat prompt, students manage context files rather than just create them, and learn to balance memory access, cybersecurity, and productivity, a balance that keeps shifting.
Messaging matters, written, verbal, and pictorial, and so does the Rule of Three. We work on how to carry yourself, write, and speak in a professional setting, and how to turn analysis into a story an audience can act on. We also study messaging in the wild: how the Fed, a major player, went from almost no public communication in the 1950s to messaging nearly every day. What changed, and what does that tell us about the system it manages?
The outcome: Students leave more grounded, more self-directed, and more employable, with their sense of what they bring to the table sharpened by the work.
For students, faculty, and partners interested in the Risk Dimensions Mentor Program, the apprenticeship model, or supporting the work.
The content provided by Risk Dimensions is for informational and educational purposes only. It does not constitute financial, investment, legal, or tax advice. Student analysis referenced here reflects independent work produced with guidance from Mark Connors as an individual, separate from any professional capacity. You should consult with a qualified professional before making any financial decisions.